

Ask an HVAC owner for next year's budget in October and most will give you one number. This year's revenue, plus 10 or 15 percent. That is a goal. It is not a budget, and it falls apart in the first mild week of spring.
HVAC budget planning means deciding, before January 1, how much profit the company will make next year and what it will take to get there. Q4 is when that gets decided, whether you plan it or not.
A real budget is built from the bottom up: how many calls come in, how many your techs run, what they convert, what your salesmen close, and what it costs to deliver the work.
What HVAC Budget Planning Actually Is
A budget is a profit plan. It starts with the profit you want and works backward to the revenue, margin, and overhead required to produce it.
That order matters. Start with revenue, and profit becomes whatever is left over. Start with profit, and every other line has to justify itself.
A working HVAC budget has five parts:
- Revenue. By department and by month: service, maintenance, and install
- Gross margin. Direct costs for each department on its own
- Marketing. Built from the calls and leads the plan requires
- Overhead. Every line, including every planned hire
- Cash. A forecast that shows when the money actually lands
Why It Happens In Q4
Q4 gives an HVAC company recent operating data and time to act before the new year.
- The cooling season is in the books. You know what the summer produced: calls, conversion rate, close rate, average ticket, and margin by department
- The shoulder season gives you room. Between the last cooling calls and the first cold snap, the board is lighter. It can give owners and managers room to step back and plan
- Plan for cost changes. Check the effective dates for equipment price increases, health insurance renewals, workers comp, raises, and your own price book before locking the budget
- Decisions need lead time. A tech you need in June has to be hired and trained by April. A truck for summer is ordered months ahead
- Year-end tax moves depend on the plan. Whether to buy trucks in December is a different answer if next year's budget shows a tight spring
Build Revenue From The Funnel
Revenue is funnel math. Calls come in, get booked, get run, and get sold. Every step has a rate, and the budget is built by setting each one.
Two terms to keep straight in this example. Conversion rate belongs to service techs: the share of calls run that turn into a paid job. Close rate belongs to salesmen: the share of sales appointments that turn into a signed system replacement.
Take an illustrative residential HVAC company at about $4.3 million in revenue. These are planning assumptions, not a client result or an industry benchmark. It runs two funnels, and they move through the same four steps.
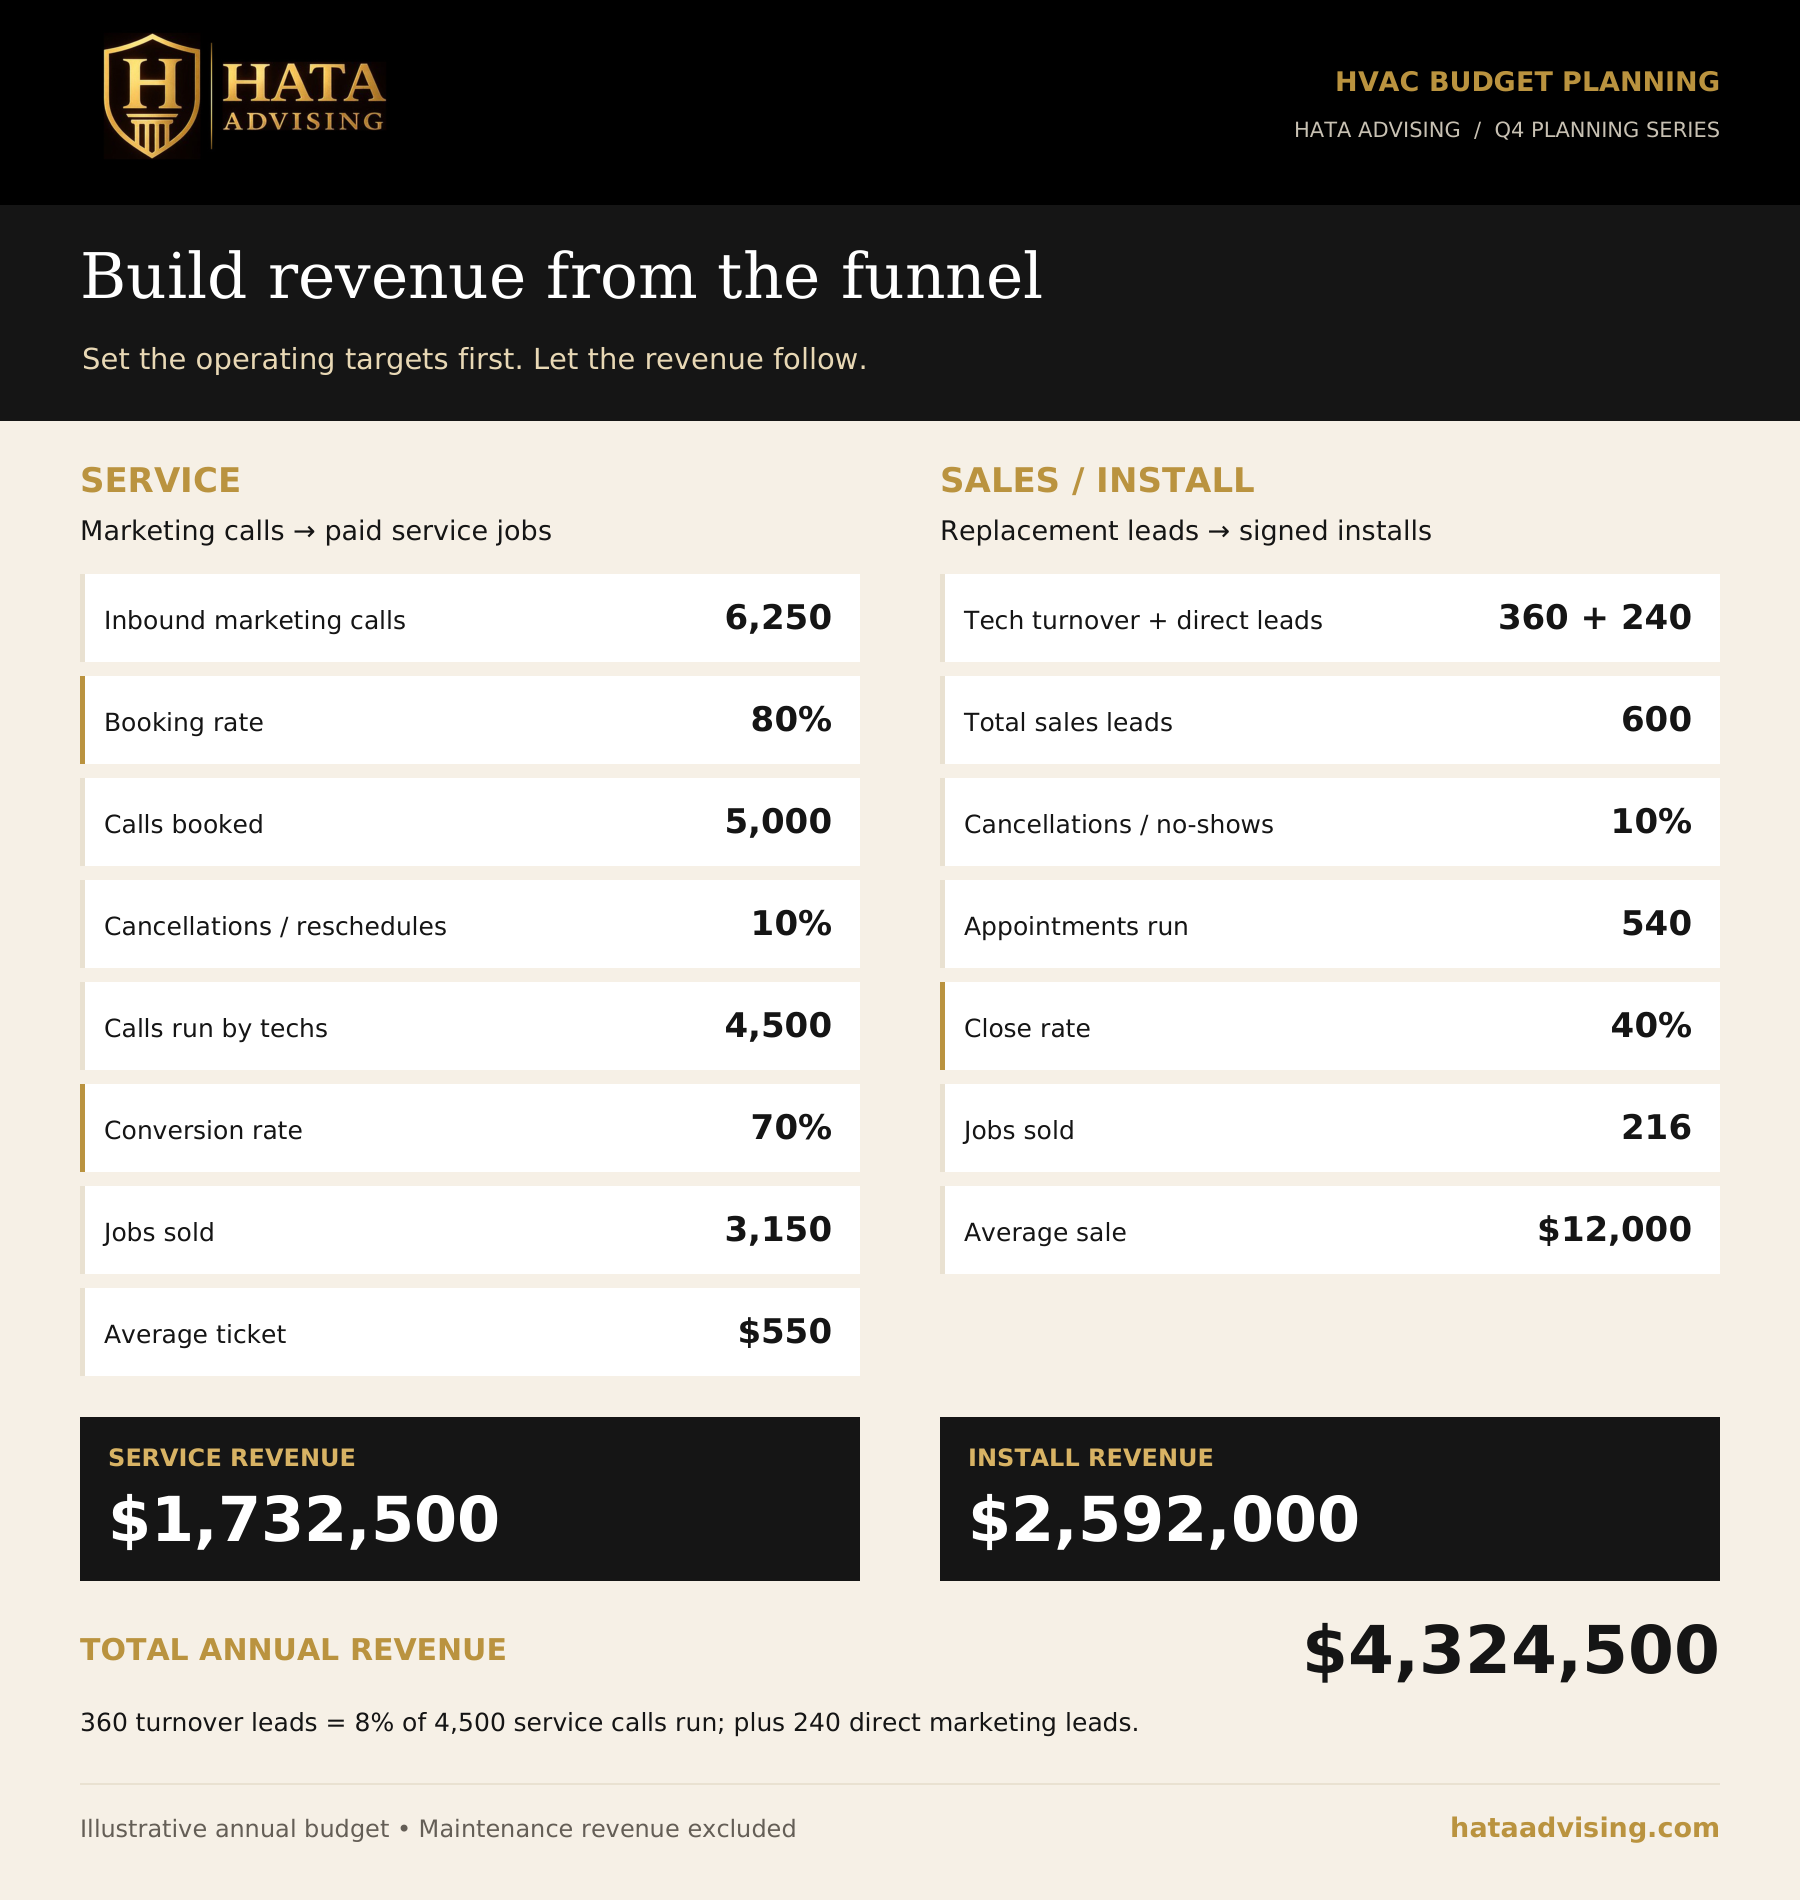
The service funnel. It starts with a marketing call.
- Calls in. 6,250 inbound calls from marketing at an 80 percent booking rate is 5,000 calls booked
- Calls run. Lose 10 percent to cancellations and reschedules and the techs run 4,500
- Conversion rate. At 70 percent, that is 3,150 jobs sold
- Service revenue. At a $550 average ticket, that is $1,732,500
The sales funnel. It starts with a replacement lead, either turned over by a tech or sent straight from marketing.
- Leads in. Techs turn over 8 percent of the calls they run, which is 360 leads. Marketing sends 240 more direct to sales, for 600
- Appointments run. Lose 10 percent to cancellations and no-shows and the salesmen run 540
- Close rate. At 40 percent, that is 216 jobs sold
- Install revenue. At a $12,000 average sale, that is $2,592,000
Service plus install comes to $4,324,500. The funnels are connected. Every call a tech runs is a chance to turn over a replacement lead, so a slow service board shows up in install revenue a few weeks later.
Maintenance agreements are the third revenue line. Tune-up visits are scheduled, not marketed, and they fill the board in spring and fall. Budget them from the membership count. They are left out of this example to keep the math readable.
Then check the funnel against capacity. 4,500 calls run is 6 techs at 3 calls a day for 250 working days. 540 sales appointments is 2 salesmen at 5 to 6 a week. 216 installs is 1 crew at 4 to 5 jobs a week. That is the annual average. The real test is the peak. If July needs 5 calls a day per tech, the budget needs a hire with a start month.
What Each Rate Is Worth
Each rate has an owner, and a small move in any one of them changes the year. Holding everything else in the example constant:
- Conversion rate, 70 to 75 percent. The service techs add $123,750
- Average ticket, $550 to $600. The service techs add $157,500
- Turnover rate, 8 to 10 percent. The service techs add $388,800 in install revenue
- Close rate, 40 to 45 percent. The salesmen add $324,000
None of those four takes another marketing dollar. That is why the budget sets a target for every rate, not only for revenue.
Booking rate is the CSR lever. Going from 80 to 85 percent produces about 313 more bookings and, after the same 10 percent cancellation rate, about 281 more calls run. That only helps if a tech is free to run them.
Then take the budget down to the individual. $1,732,500 across 6 techs is $1,155 per tech per working day. $2,592,000 across 2 salesmen is about $1.3 million each. Those are numbers a manager can coach to every week.
Margin, Marketing, Overhead, And Cash
Revenue is one of five answers. The other four decide whether any of it turns into profit.
Gross margin by department. Budget labor, equipment, materials, and subcontractors for service and install separately. A blended margin hides the department that is losing money. Include the costs that get missed: sales commissions, technician spiffs, financing dealer fees, permits, and warranty callbacks. In the example, service is budgeted at 60 percent and install at 45 percent. If equipment costs rise 6 percent and wages rise 5 percent, holding the price book flat is a decision to earn less.
Marketing from the funnel. Work backward from the calls the plan needs, not from last year's spend. The example needs 6,250 service calls and 240 direct replacement leads. At $50 per call and $150 per lead, that is $348,500, about 8 percent of revenue. Plan the spend around monthly lead targets and the cooling and heating seasons. Do not assume July will fill itself.
Overhead with growth built in. List every overhead line and every planned hire with a start month. Growth costs overhead before it produces revenue. The budget shows how long that gap lasts and whether you can carry it.
Cash by month. Profit and cash are different numbers. Truck purchases, inventory, debt principal, tax payments, and owner distributions affect cash differently from reported profit. A truck may be depreciated over time, inventory becomes an expense as it is sold or used, and debt principal and owner distributions are not operating expenses. HVAC cash is seasonal. Summer builds the balance and the shoulder months drain it. A monthly cash forecast shows the tight months in advance and gives you time to discuss financing before cash gets tight.
What This Looks Like In Practice
Put the five answers together for the example company and the HVAC budget fits on one page.
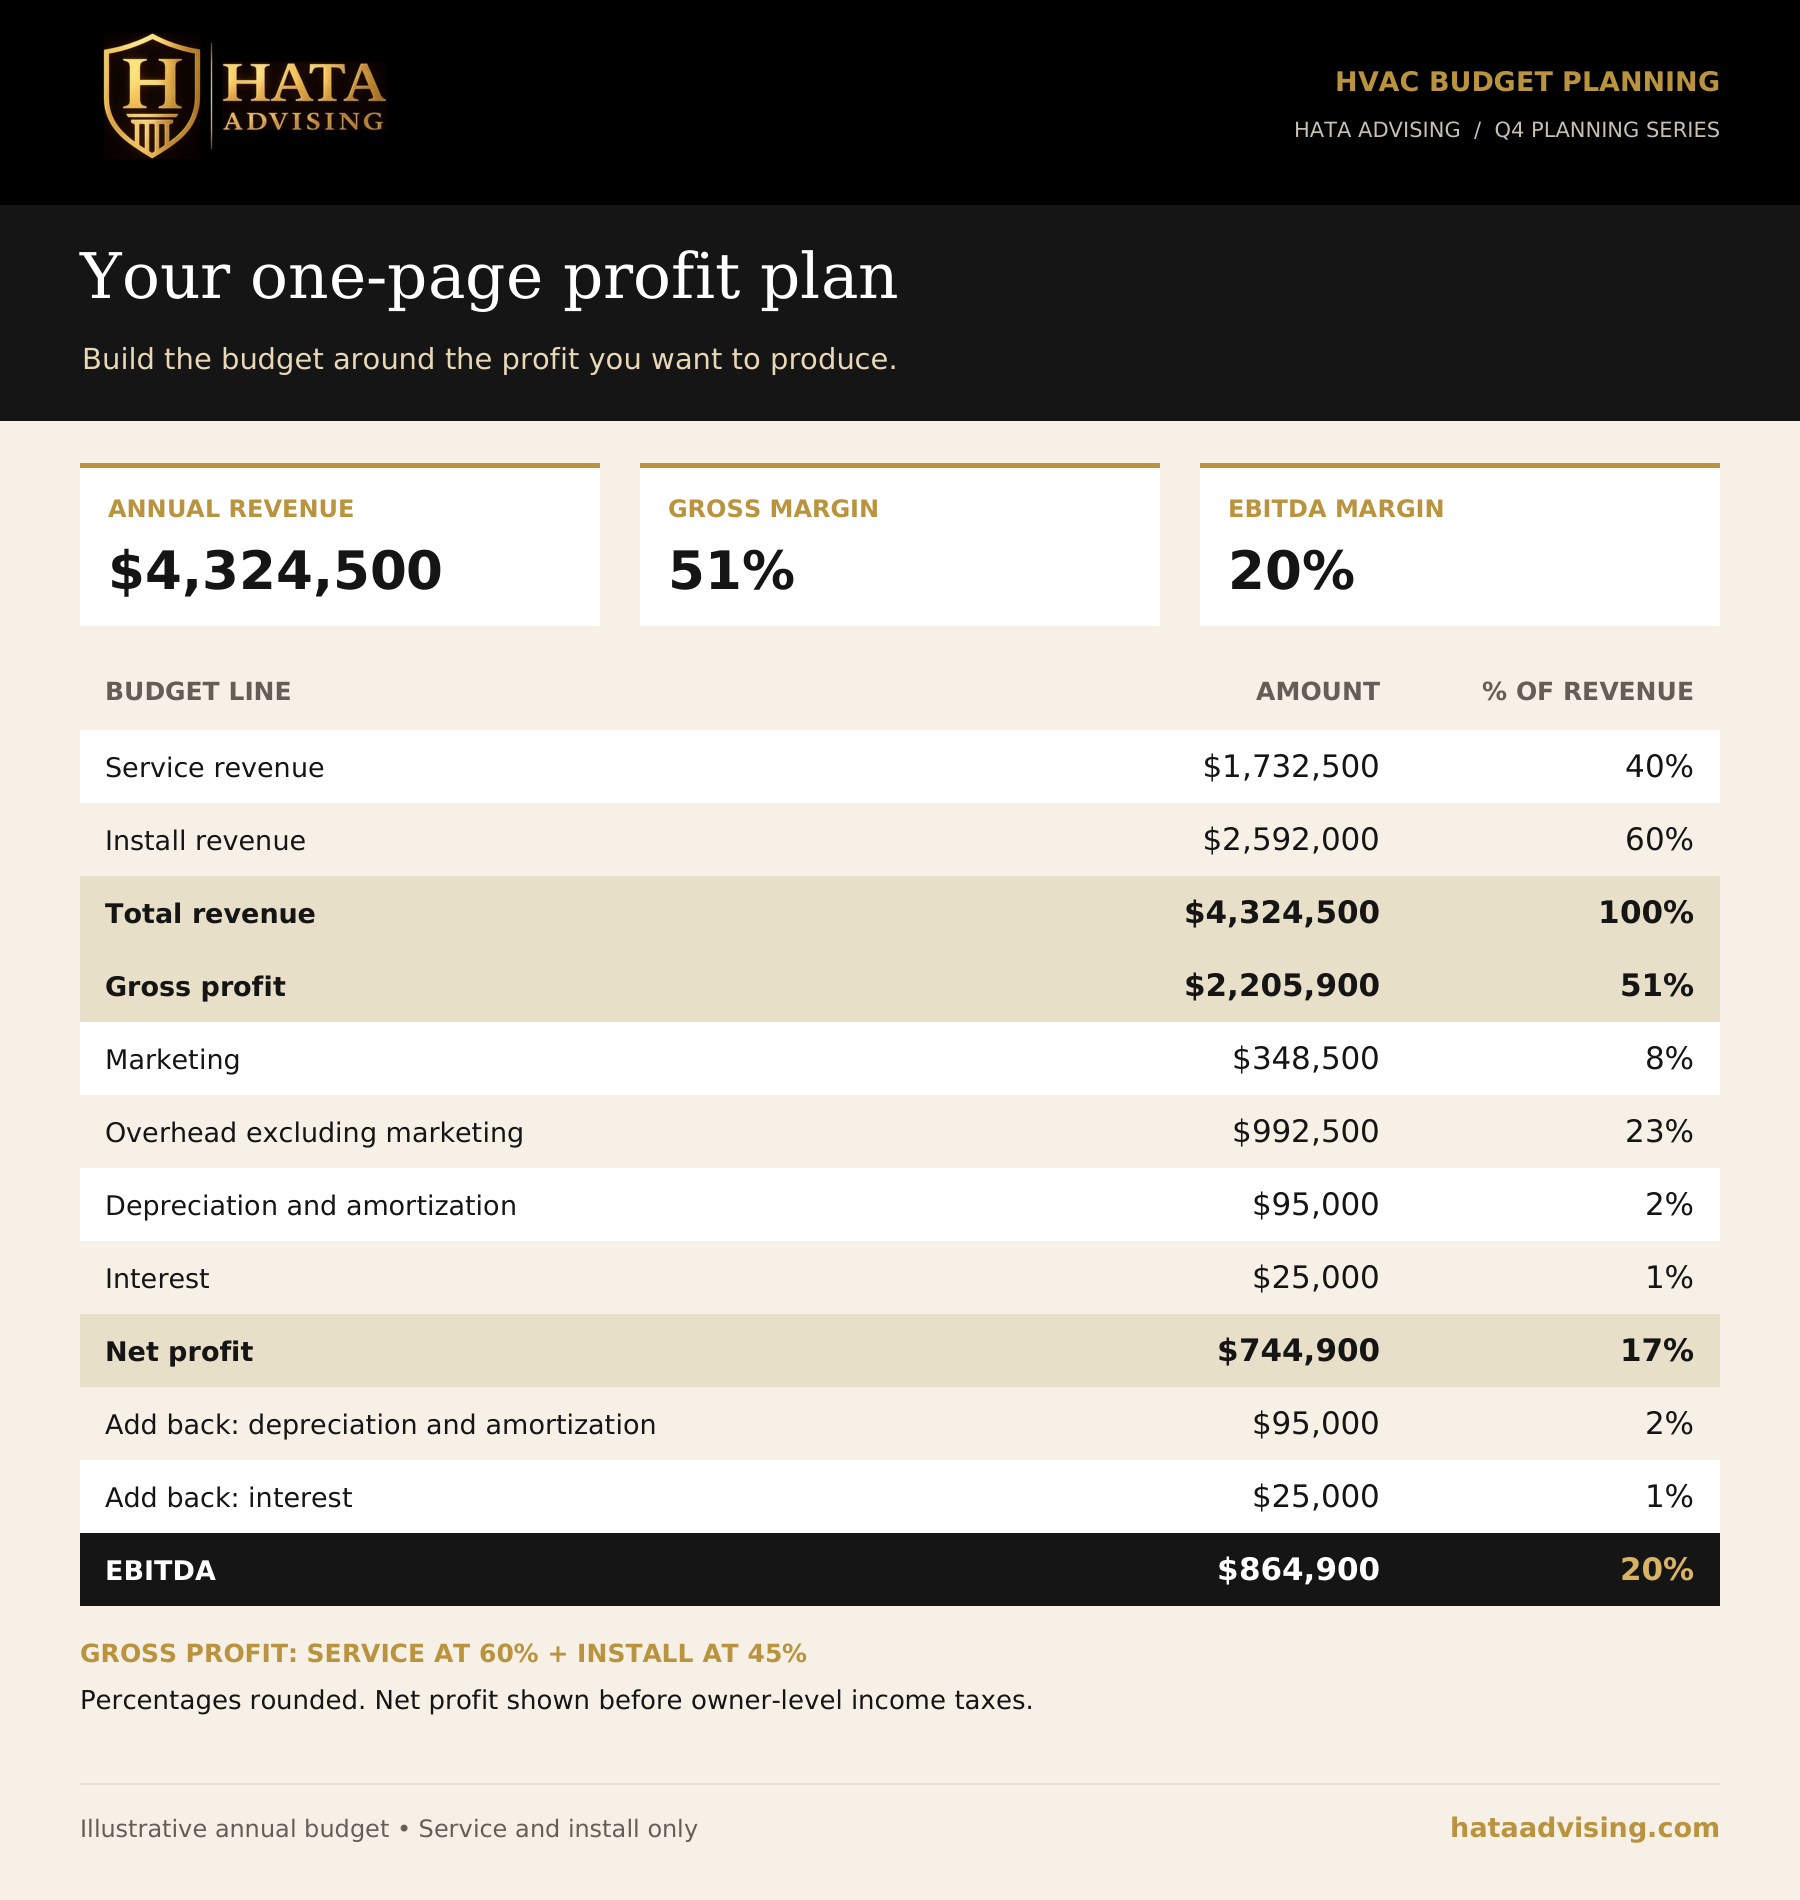
View the budget as a readable text table
| Budget line | Annual amount |
|---|---|
| Service revenue | $1,732,500 |
| Install revenue | $2,592,000 |
| Total revenue | $4,324,500 |
| Gross profit | $2,205,900 (51%) |
| Marketing | $348,500 (8%) |
| Overhead excluding marketing | $992,500 (23%) |
| Depreciation and amortization | $95,000 (2%) |
| Interest | $25,000 (1%) |
| Net profit | $744,900 (17%) |
| EBITDA | $864,900 (20%) |
Gross margin is budgeted at 60 percent for service and 45 percent for install. Add $95,000 of depreciation and amortization and $25,000 of interest back to the $744,900 net profit to reach $864,900 EBITDA.
Percentages are rounded. The target was a 20 percent EBITDA margin. Every line above it had to fit under that number, and every line traces back to a rate somebody owns.
EBITDA is a useful budget target because lenders and buyers often consider it when evaluating a business. It belongs alongside net profit, cash flow, debt service, and working capital. This example assumes a pass-through business with income taxes paid by the owners, so it has no entity-level income tax line. Add any applicable business income taxes to your own plan and include owner tax distributions in the cash forecast.
The Q4 Timeline
Start in October and the budget is locked before the holidays.
- October: pull the facts. Get the year-to-date P&L by department and the operating numbers from your CRM. Clean up the books first. A budget built on miscoded numbers is wrong on day one
- Early November: set the target and build revenue. Decide the EBITDA and net profit you want, then build service, maintenance, and install revenue from the funnel
- Mid November: build the costs. Direct costs by department, marketing, overhead, and planned hires with start months. Set price book and wage changes here
- Early December: spread it by month and forecast cash. July looks nothing like March. Budget a normal weather year
- Mid December: pressure-test and commit. Run a downside case with a mild summer and revenue 15 percent short. Know which costs you would cut and when. Then give each manager their targets
- January: load it. Put the budget into your accounting system so every monthly report shows budget next to actual
Where HVAC Budgets Go Wrong
Last year plus a percentage. It carries forward every bad habit and ignores what your techs and crews can physically produce.
Budgeting on last summer's weather. A record heat wave is not a plan. Budget a normal year and treat the heat wave as upside.
One number for the whole company. Blended figures hide whether service or install is dragging the other down.
Twelve equal months. Divide the year by 12 and you look behind every shoulder month and ahead every peak month.
No cash plan. A profitable HVAC budget can still run out of money in April.
Built by the owner alone. A service manager or sales manager who had no hand in the number does not own it.
Built once and filed. A budget nobody opens after January changes nothing.
After January 1
The budget earns its keep in the monthly review. Compare actual to budget line by line and ask why on every meaningful miss. That only works if the books close fast. A review in the fourth week of the following month leaves less time to act on a problem.
Between closes, track the weekly numbers that feed the budget: inbound calls, booking rate, calls run, conversion rate, average ticket, turnover rate, close rate, and cost per call. Those move before the P&L does. Reforecast every quarter, and again after the cooling season.
The Bottom Line
Next year's profit gets decided in Q4. The HVAC companies that hit their numbers are the ones that built them in October and November, rate by rate and department by department, and then checked them every month.
If you do not have a budget for next year yet, you have about 90 days. That is enough time if you start now.
No budget for next year yet? Hata Advising builds budgets and forecasts for HVAC and home services companies, with CPA-led accounting, reporting, and CFO support. Request a consultation or call 801.631.5123.